A lot of tenants think of the typical landlord as Scrooge Mcduck. Taking the rental income and using it to fill a giant pool with gold coins to dive into. Sadly, that’s not the case.
As 2012 draws to a close, we decided to dig into our books to get a global picture of where rental income actually goes. As those who rent from us and work with us know, we’re an open book. So in the spirit of openness, we’re giving our tenants a dollar by dollar breakdown of where your rent goes.
A few notes: I tried to find a quote that someone once told me about accounting. The CEO says to his accountant “How much did we make?”, to which the account replies “how much do you want to have made?”. And so goes with accounting. There are so many ways to look at identical numbers and draw different results.
While our accounting system can generate reports that show every dollar in and out, we have some property types (mortgage notes from properties we sold via seller financing, single family homes with only partial income/expense capture in the system, vacation homes, places we manage for others, etc.) that are not applicable that throw things off. I removed most of those. However, the largest problem with a company like ours doing a report like this is we are often operationally negative on a property for up to years due to capital improvements put into the property. So if we buy a building and put $200k of improvements in, then a report like this would show more than $1 being spent for every $1 of rent collected that first year. And we bought a lot of new properties in 2012.
This also doesn’t take into account insurance costs, which I noticed were not included after I did the chart. Also, the ‘supplies/repairs’ might be inflated as it captures some capital improvements as noted above. And the mortgage number includes principal portions of payments that shouldn’t be included. So I guess what I’m trying to say is the chart below is close, but not exact.
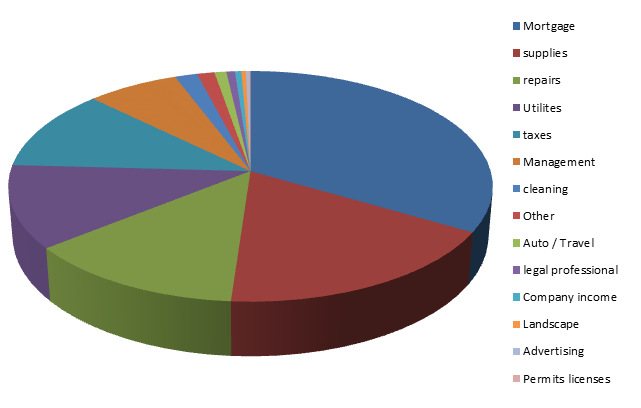
If we take a rental amount of $800 a month, here is where your rent goes:
Mortgage: $267
Supplies: $142
Repairs: $105
Utilities: $105
Taxes: $91
Management fees: $56
Cleaning: $14
Other: $11
Auto / Travel: $7
Legal: $5
Company income: $4
Landscape: $3
Advertising: $2
Permits: $1
So using the estimated data above, about 5 cents out of every dollar goes into the companies coffers for growth. So if one month of rent isn’t paid on a unit, it takes almost two years of renting that unit out before we’re even again.
Again, this is likely not typical as we are not the typical real estate company, but it should be at least an entertaining look at where rental income ends up.
You must be logged in to post a comment.